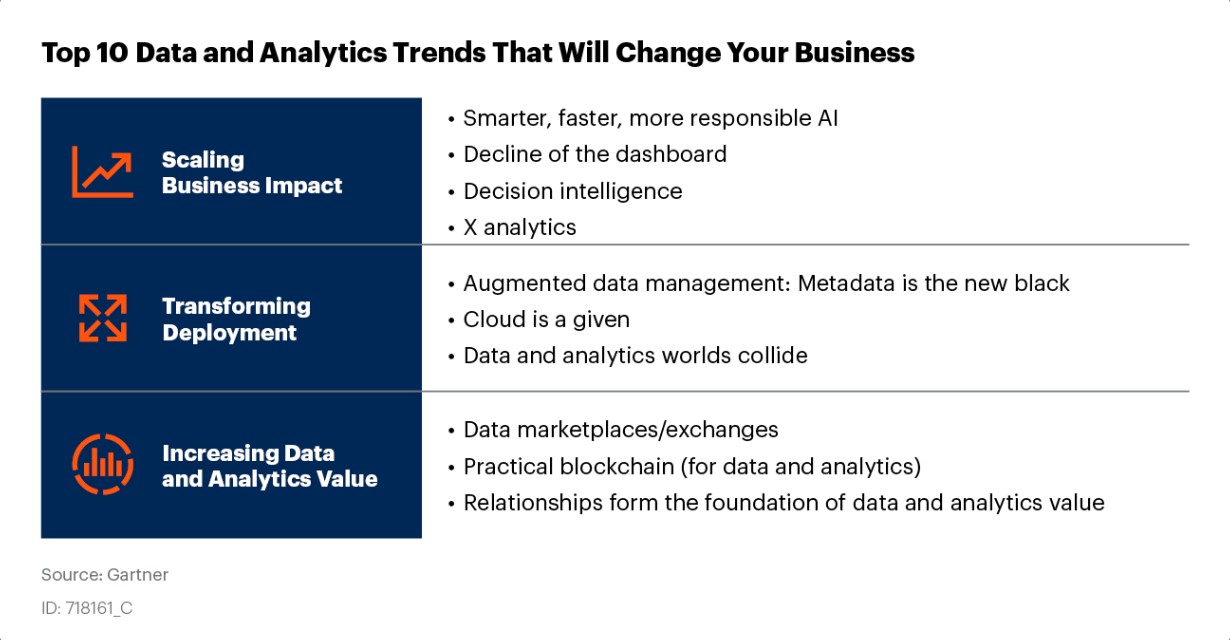
Bangkok, 1 July 2020 — Gartner, Inc. identified the top 10 data and analytics (D&A) technology trends for 2020 that can help data and analytics leaders navigate their COVID-19 response and recovery and prepare for a post-pandemic reset.

“To innovate their way beyond a post-COVID-19 world, data and analytics leaders require an ever-increasing velocity and scale of analysis in terms of processing and access to succeed in the face of unprecedented market shifts,” said Rita Sallam, distinguished research vice president at Gartner.
Data and analytics leaders should examine the following 10 data and analytics trends to accelerate renewal or recovery post COVID-19 pandemic:

Trend 1: Smarter, Faster, More Responsible AI
By the end of 2024, 75% of organizations will shift from piloting to operationalizing artificial intelligence (AI), driving a 5 times increase in streaming data and analytics infrastructures.
Within the current pandemic context, AI techniques such as machine learning (ML), optimization and natural language processing (NLP) are providing vital insights and predictions about the spread of the virus and the effectiveness and impact of countermeasures.
Other smarter AI techniques such as reinforcement learning and distributed learning are creating more adaptable and flexible systems to handle complex business situations; for example, agent-based systems that model and simulate complex systems.
Trend 2: Decline of the Dashboard
Dynamic data stories with more automated and consumerized experiences will replace visual, point-and-click authoring and exploration. As a result, the amount of time users spend using predefined dashboards will decline. The shift to dynamic data stories that leverage for example augmented analytics or NLP, means that the most relevant insights will stream to each user based on their context, role or use.
Trend 3: Decision Intelligence
By 2023, more than 33% of large organizations will have analysts practicing decision intelligence, including decision modeling. Decision intelligence brings together several disciplines, including decision management and decision support. It provides a framework to help data and analytics leaders design, model, align, execute, monitor and tune decision models and processes in the context of business outcomes and behavior.
Trend 4: X Analytics
Gartner coined the term “X analytics” to be an umbrella term, where X is the data variable for a range of different structured and unstructured content such as text analytics, video analytics, audio analytics, etc.
During the COVID-19 pandemic, AI has been critical in combing through thousands of research papers, news sources, social media posts and clinical trials data to help medical and public health experts predict disease spread, capacity-plan, find new treatments and identify vulnerable populations. X analytics combined with AI and other techniques such as graph analytics will play a key role in identifying, predicting and planning for natural disasters and other crises in the future.
Trend 5: Augmented Data Management
Augmented data management uses ML and AI techniques to optimize and improve operations. It also converts metadata from being used in auditing, lineage and reporting to powering dynamic systems.
Augmented data management products can examine large samples of operational data, including actual queries, performance data and schemas. Using the existing usage and workload data, an augmented engine can tune operations and optimize configuration, security and performance.
Trend 6: Cloud is a Given
By 2022, public cloud services will be essential for 90% of data and analytics innovation. As data and analytics moves to the cloud, data and analytics leaders still struggle to align the right services to the right use cases, which leads to unnecessary increased governance and integration overhead.
The question for data and analytics is moving from how much a given service costs to how it can meet the workload’s performance requirements beyond the list price. Data and analytics leaders need to prioritize workloads that can exploit cloud capabilities and focus on cost optimization when moving to cloud.
Trend 7: Data and Analytics Worlds Collide
Data and analytics capabilities have traditionally been considered distinct entities and managed accordingly. Vendors offering end-to-end workflows enabled by augmented analytics blur the distinction between the two markets.
The collision of data and analytics will increase interaction and collaboration between historically separate data and analytics roles. This impacts not only the technologies and capabilities provided, but also the people and processes that support and use them. The spectrum of roles will extend from traditional data and analytics to information explorer and citizen developer as examples.
Trend 8: Data Marketplaces and Exchanges
By 2022, 35% of large organizations will be either sellers or buyers of data via formal online data marketplaces, up from 25% in 2020. Data marketplaces and exchanges provide single platforms to consolidate third-party data offerings and reduce costs for third-party data.
Trend 9: Blockchain in Data and Analytics
Blockchain technologies address two challenges in data and analytics. First, blockchain provides the full lineage of assets and transactions. Second, blockchain provides transparency for complex networks of participants.
Outside of limited bitcoin and smart contract use cases, ledger database management systems (DBMSs) will provide a more attractive option for single-enterprise auditing of data sources. By 2021, Gartner estimates that most permissioned blockchain uses will be replaced by ledger DBMS products.
Trend 10: Relationships Form the Foundation of Data and Analytics Value
By 2023, graph technologies will facilitate rapid contextualization for decision making in 30% of organizations worldwide. Graph analytics is a set of analytic techniques that allows for the exploration of relationships between entities of interest such as organizations, people and transactions. It helps data and analytics leaders find unknown relationships in data and review data not easily analyzed with traditional analytics.
Gartner clients can read more in the report “Top 10 Trends in Data and Analytics, 2020.”
About Gartner
Gartner, Inc. (NYSE: IT) is the world’s leading research and advisory company and a member of the S&P 500. We equip business leaders with indispensable insights, advice and tools to achieve their mission-critical priorities and build the successful organizations of tomorrow.
Our unmatched combination of expert-led, practitioner-sourced and data-driven research steers clients toward the right decisions on the issues that matter most. We are a trusted advisor and an objective resource for more than 15,000 organizations in more than 100 countries — across all major functions, in every industry and organization size.
To learn more about how we help decision makers fuel the future of business, visit www.gartner.com.
ในอีก 4 ปี 75% ขององค์กรจะปรับใช้เทคโนโลยี AI อย่างจริงจัง
กรุงเทพฯ ประเทศไทย 1 กรกฎาคม 2563 – การ์ทเนอร์ อิงค์ ชี้ 10 อันดับเทรนด์เทคโนโลยีด้านการวิเคราะห์และจัดเก็บข้อมูลปี 2563 ช่วยผู้บริหารฝ่ายข้อมูลพาองค์กรฝ่าวิกฤติโควิด-19 พร้อมเตรียมพลิกฟื้นกิจการหลังจากนี้
นางริต้า ซัลแลม รองประธานฝ่ายวิจัยการ์ทเนอร์ อิงค์ กล่าวว่า “อีกหนึ่งแนวทางสำคัญเพื่อพลิกฟื้นและวางแผนธุรกิจรับมือกับความผกผันของเศรษฐกิจหลังโควิด-19 ได้อย่างมีประสิทธิภาพ คือ การผลักดันกลยุทธ์องค์กรที่ขับเคลื่อนด้วยดาต้า ผู้บริหารฝ่ายข้อมูลขององค์กรจึงต้องอาศัยโซลูชันที่ตอบโจทย์เรื่องการเข้าถึงข้อมูลและการประมวลผลที่รวดเร็วแม่นยำ พร้อมทั้งความสามารถในการสเกลระบบวิเคราะห์ข้อมูลเพื่อรองรับรูปแบบการทำงานใหม่ ๆ ที่จะเกิดขึ้นในอนาคตได้”
รายงานจากการ์ทเนอร์ อิงค์ เผย 10 เทรนด์ของดาต้าและเทคโนโลยีการวิเคราะห์ข้อมูล เพื่อให้ผู้บริหารฝ่ายข้อมูลพิจารณาใช้เป็นแนวทางเร่งพลิกฟื้นกิจการและสร้างความได้เปรียบทางการแข่งขันอย่างต่อเนื่องหลังสถานการณ์โควิด-19 คลี่คลายดังนี้:
เทรนด์ 1: AI ที่ฉลาดขึ้น เร็วขึ้น มาพร้อมกับหน้าที่เยอะขึ้น (Smarter, Faster, More Responsible AI)
ภายในสิ้นปี 2567 องค์กร 75% จะเปลี่ยนไปใช้ปัญญาประดิษฐ์หรือเอไอ (AI) อย่างจริงจัง ส่งผลให้เกิดการสตรีมข้อมูลและการวิเคราะห์โครงสร้างพื้นฐานเพิ่มขึ้น 5 เท่า
จากการระบาดของไวรัสที่เกิดขึ้นในปัจจุบัน เราได้เห็นความสำคัญของการนำเทคโนโลยี AI เช่น ระบบการเรียนรู้พฤติกรรมหรือแมชชีนเลิร์นนิ่ง (ML) มาเพิ่มประสิทธิภาพและการประมวลผลภาษาธรรมชาติ/มนุษย์ (NLP) ให้ข้อมูลเชิงลึกและช่วยคาดการณ์การแพร่กระจายของไวรัสได้อย่างมีประสิทธิผล รวมถึงวัดผลมาตรการการรับมือการแพร่ระบาดของไวรัสดังกล่าว
เทคโนโลยีอัจฉริยะอื่น ๆ ที่ขับเคลื่อนด้วย AI อาทิ การเรียนรู้แบบเสริมกำลัง (Reinforcement Learning) หรือการกำหนดเงื่อนไขบางอย่างให้แมชชีนได้เรียนรู้และปิดช่องโหว่ที่พบเพื่อบรรลุเงื่อนไขที่กำหนดไว้ และการเรียนรู้แบบกระจาย (Distributed Learning) หรือแนวคิดในการเชื่อมโยงองค์ประกอบต่าง ๆ ที่เกี่ยวข้องในกระบวนการเรียนรู้ผ่านการใช้เครือข่ายคอมพิวเตอร์ สิ่งเหล่านี้ทำให้เกิดการสร้างระบบที่มีสเกลได้และยืดหยุ่นเพื่อจัดการกับสถานการณ์ทางธุรกิจที่ซับซ้อนได้ดียิ่งขึ้น เช่น ระบบ agent-based ที่ใช้โมเดลเป็นตัวแทนในแบบจำลองและวิเคราะห์ระบบที่มีความซับซ้อน
เทรนด์ 2: แดชบอร์ดยังจำเป็นอยู่หรือไม่?(Decline of the Dashboard)
การรายงานผลแบบไดนามิกที่เน้นมอบประสบการณ์แก่ผู้ใช้งานจริงได้อัตโนมัติจะเข้ามาแทนที่คอนเทนท์บนแดชบอร์ดรูปแบบเดิมจากที่เคยโชว์สรุปผลแบบรูปภาพ point-and-click และผลสำรวจการใช้งาน ด้วยเทคโนโลยี augmented analytics หรือ NLP จะเข้าวิเคราะห์ข้อมูลเชิงลึกอ้างอิงจากบทบาทหน้าที่และประสบการณ์ใช้งานจริงและจะสตรีมคอนเทนท์ที่ตอบโจทย์การใช้งานไปยังผู้ใช้แต่ละรายได้อัตโนมัติ ส่งผลให้ให้ผู้ใช้ใช้เวลาบนแดชบอร์ดที่กำหนดค่าไว้ล่วงหน้าน้อยลง
เทรนด์ 3: บริหารจัดการข้อมูลแบบสมาร์ท เร่งกระบวนการตัดสินใจได้เร็วและดีขึ้น (Decision Intelligence)
ในปี 2566 องค์กรขนาดใหญ่มากกว่า 33% จะมีทีมนักวิเคราะห์ข้อมูลปฏิบัติงานในด้าน Decision Intelligence รวมถึง Decision Modeling โดยการทำงานในด้าน Decision Intelligence จะนำไปสู่การกำหนดเกณฑ์การวิเคราะห์มากมาย ประกอบด้วย การจัดการการตัดสินใจ (Decision Management) และการสนับสนุนการตัดสินใจ (Decision Support) ซึ่งช่วยกำหนดกรอบการปฏิบัติงานด้านการออกแบบ จัดวาง ดำเนินการ ตรวจสอบและปรับแต่งรูปแบบการตัดสินใจให้แก่ผู้บริหารฝ่ายข้อมูล รวมถึงกระบวนการอื่น ๆ ที่สร้างผลลัพธ์ในเชิงธุรกิจและเรียนรู้พฤติกรรมผู้บริโภค
เทรนด์ 4: X Analytics
ทฤษฎี “X analytics” ของการ์ทเนอร์เป็นคำศัพท์ที่ใช้กันอย่างแพร่หลาย โดย X ถูกกำหนดให้เป็นตัวแปลข้อมูลด้านการวิเคราะห์ของช่วงเนื้อหาที่แตกต่างกันครอบคลุมทั้งข้อมูลดิบและข้อมูลที่ผ่านการประมวลผลพร้อมใช้งาน เช่น การวิเคราะห์ข้อความ วิดีโอ เสียง และข้อมูลอื่น ๆ
ช่วงการระบาดของโควิด-19 เทคโนโลยี AI มีความสำคัญอย่างยิ่งต่อการประมวลผลและจัดการข้อมูลต่าง ๆ หลายพันเรื่อง ทั้งงานวิจัย แหล่งข้อมูลข่าวสาร ข้อความที่ถูกโพสต์บนโซเชียลมีเดีย รวมถึงข้อมูลการทดลองทางคลินิกเพื่อช่วยผู้เชี่ยวชาญทางการแพทย์และสาธารณสุขคาดการณ์การแพร่กระจายของโรค อีกทั้งยังสามารถช่วยวางแผน ค้นหาแนวทางการรักษาใหม่ ๆ พร้อมระบุประชากรที่มีความเสี่ยง นอกจากนี้ทฤษฎี “X analytics” ของการ์ทเนอร์ยังถูกนำไปใช้ร่วมกับ AI และเทคนิคอื่น ๆ เพื่อเพิ่มศักยภาพในการวิเคราะห์ เช่น นำ AI ใช้ร่วมกับเทคนิคการวิเคราะห์ด้วยกราฟช่วยเพิ่มความแม่นยำในการระบุ คาดการณ์ และวางแผนรับมือภัยธรรมชาติและวิกฤตอื่น ๆ ในอนาคตได้ดียิ่งขึ้น
เทรนด์ 5: กระบวนการปรับแต่งข้อมูลอัตโนมัติ (Augmented Data Management)
Augmented Data Management หรือกระบวนการปรับแต่งข้อมูลอัตโนมัติโดยใช้แมชชีนเลิร์นนิ่งและเอไอช่วยเพิ่มประสิทธิภาพและพัฒนาศักยภาพไปสู่การวิเคราะห์ ข้อมูลอภิพันธุ์ (Metadata) ที่ใช้ในการตรวจสอบบัญชี ความสัมพันธ์ของข้อมูล และการรายงานในรูปแบบไดนามิกซิสเต็มส์
ผลิตภัณฑ์ของ Augmented Data Management สามารถตรวจสอบตัวอย่างข้อมูลการปฏิบัติงานจำนวนมาก ประกอบด้วย การค้นหาจริง (Actual Queries), ข้อมูลเชิงปฏิบัติงาน (Performance Data) และโครงสร้างข้อมูล (Schemas) โดยใช้ข้อมูลจากการใช้งานจริงและข้อมูลเวิร์คโหลด Augmented Engine สามารถช่วยปรับแต่งประสิทธิภาพและกำหนดค่าความปลอดภัยได้
เทรนด์ 6: Cloud เป็นของที่ต้องมี (Cloud is a Given)
ภายในปี 2565 คลาวด์สาธารณะหรือ Public Cloud จะมีบทบาทสำคัญต่อการคิดค้นนวัตกรรมทางด้านการวิเคราะห์และข้อมูลถึง 90% เนื่องจากข้อมูลและการวิเคราะห์ถูกย้ายขึ้นไปอยู่บนคลาวด์ โดยผู้บริหารฝ่ายข้อมูลยังมีความท้าทายสำคัญในการมองหาบริการที่เหมาะสมและสอดรับกับรูปแบบการใช้งานต่าง ๆ เพื่อลดค่าใช้จ่ายที่จะเกิดจากการใช้โซลูชันที่ไม่รองรับการสเกลระบบที่อาจเกิดขึ้นในอนาคต
ซึ่งทำให้วันนี้คำถามที่เกิดขึ้นเมื่อต้องการซื้อบริการด้านดาต้าและการวิเคราะห์ข้อมูลเปลี่ยนจากความสนใจเรื่องค่าบริการไปเป็น บริการนี้มีความสามารถอะไรบ้าง? ตอบโจทย์ความต้องการด้านการทำงานหรือไม่อย่างไร? ขณะเดียวกันผู้บริหารที่ดูแลด้านดาต้าและการวิเคราะห์จำเป็นต้องจัดลำดับความสำคัญของเวิร์คโหลดที่อาจทำให้ประสิทธิภาพการทำงานของคลาวด์ถูกลดทอนไปได้และให้ความสำคัญไปที่การบริหารความคุ้มค่าเมื่อต้องเปลี่ยนรูปแบบการดำเนินธุรกิจไปสู่คลาวด์
เทรนด์ 7: การปะทะกันของโลกแห่งข้อมูลและการวิเคราะห์ (Data and Analytics Worlds Collide)
โดยปกติการเลือกใช้เทคโนโลยีดาต้าและอนาไลติกส์จะแตกต่างกันไปในแต่ละองค์กร โดยใช้อัตลักษณ์และรูปแบบการบริหารจัดการของแต่ละองค์กรมาพิจารณาเลือกเทคโนโลยีให้เหมาะกับการใช้งาน ผู้จำหน่ายโซลูชันจะเสนอขาย เวิร์กโฟลว์แบบครบวงจรโดยเปิดใช้งานการวิเคราะห์ข้อมูลแบบอัตโนมัติด้วยเทคโนโลยี augmented analytics ซึ่งยากต่อการแยกแยะความแตกต่างของสองตลาด
การชนกันของข้อมูลและระบบวิเคราะห์จะเพิ่มการโต้ตอบและการทำงานร่วมกันระหว่างข้อมูลเก่าที่ถูกส่งออกและระบบการวิเคราะห์ข้อมูล เป็นผลกระทบที่เกิดขึ้นไม่เพียงต่อเทคโนโลยีและความสามารถที่มีอยู่ในโซลูชัน แต่เกิดขึ้นกับคนและกระบวนการสนับสนุนและใช้งาน ตัวอย่างการทำงานคล้ายกับเกิดเป็นรูปแบบการทำงานของสเปกตรัมโดยเริ่มขยายจากข้อมูลดิบเดิม สู่การวิเคราะห์ข้อมูล และส่งต่อไปยังนักวิเคราะห์ข้อมูล และนักพัฒนาทั่ว ๆ ไป
เทรนด์ 8: ตลาดและการแลกเปลี่ยนข้อมูล (Data Marketplaces and Exchanges)
ในปี 2565 องค์กรขนาดใหญ่ราว 35% จะกลายเป็นทั้งผู้ซื้อและผู้ขายข้อมูลผ่านออนไลน์มาร์เก็ตเพลส โดยโตจาก 25% ในปี 2563 ซึ่งแพลตฟอร์มการแลกเปลี่ยนข้อมูลและดาต้ามาร์เก็ตเพลสจะกลายเป็นแหล่งรวมข้อมูลออนไลน์เดียวที่จัดเก็บข้อมูลจากแหล่งต่าง ๆ ไว้สำหรับนำไปใช้และลดต้นทุนให้กับองค์กร
เทรนด์ 9: บล็อกเชนที่อยู่ในดาต้าและการวิเคราะห์ข้อมูล (Blockchain in Data and Analytics)
เทคโนโลยีบล็อกเชนชี้ให้เห็นความท้าทายสำคัญสองสิ่งเกี่ยวกับดาต้าและการวิเคราะห์ อย่างแรก คือ บล็อกเชน รวบรวมข้อมูลสินทรัพย์และธุรกรรมทั้งหมด และอย่างที่สอง คือ บล็อกเชนมีความโปร่งใสแม้เครือข่ายมีความซับซ้อนและผู้ใช้หลากหลาย
นอกจากกรณีการใช้ Bitcoin และ Smart Contract ยังมีระบบจัดการฐานข้อมูลบัญชีแยกประเภท (หรือ DBMSs) ที่นำเสนอตัวเลือกน่าสนใจในการตรวจสอบข้อมูลจากแหล่งที่มาได้หลากหลายผ่าน single-enterprise auditing การ์ทเนอร์คาดการณ์ว่าในปี 2564 บล็อกเชนได้รับใบอนุญาตประกอบธุรกิจสินทรัพย์ดิจิทัลส่วนใหญ่จะถูกแทนที่ด้วยผลิตภัณฑ์ DBMS
เทรนด์ 10: ความสัมพันธ์สร้างรากฐานแก่ข้อมูลและเพิ่มคุณค่าในการวิเคราะห์ (Relationships Form the Foundation of Data and Analytics Value)
ในปี 2566 องค์กรต่าง ๆ ทั่วโลกราว 30% จะใช้เทคโนโลยีกราฟในการวิเคราะห์ข้อมูลซึ่งช่วยในการตัดสินใจทางธุรกิจได้อย่างรวดเร็ว การวิเคราะห์ข้อมูลด้วยกราฟ เป็นเทคนิคหนึ่งในการวิเคราะห์ข้อมูลที่ข้อมูลนั้นถูกจัดให้อยู่ในรูปแบบเชิงความสัมพันธ์ โดยใช้วิเคราะห์ความสัมพันธ์ของรายละเอียดต่าง ๆ เช่น องค์กร คน และธุรกรรมต่าง ๆ มันช่วยให้ผู้บริหารฝ่ายข้อมูลค้นพบความสัมพันธ์ของข้อมูลใหม่ ๆ และตรวจสอบข้อมูลที่ไม่สามารถวิเคราะห์ได้ด้วยวิธีการแบบเดิม
ลูกค้าการ์ทเนอร์สามารถคลิกอ่านรายงานเพิ่มเติมได้ที่ Top 10 Trends in Data and Analytics, 2020
เกี่ยวกับการ์ทเนอร์
บริษัท การ์ทเนอร์ (Gartner, Inc.) (NYSE: IT) คือบริษัทวิจัยและให้คำปรึกษาชั้นนำของโลก และมีรายชื่ออยู่ในดัชนี S&P 500 บริษัทฯ ให้ข้อมูลเชิงลึก คำแนะนำ และเครื่องมือต่าง ๆ แก่ผู้บริหารองค์กรธุรกิจ เพื่อรองรับการดำเนินภารกิจสำคัญที่มีอยู่ในปัจจุบันและสร้างองค์กรให้ประสบความสำเร็จในอนาคต
การ์ทเนอร์นำเสนองานวิจัยที่ขับเคลื่อนด้วยข้อมูล ดำเนินการโดยผู้เชี่ยวชาญ และใช้แหล่งข้อมูลจากผู้ปฏิบัติงานจริง เพื่อชี้นำลูกค้าสำหรับการตัดสินใจที่ถูกต้องเหมาะสมในเรื่องที่สำคัญที่สุด การ์ทเนอร์ทำหน้าที่เป็นแหล่งข้อมูลที่เป็นกลางและเป็นที่ปรึกษาที่ได้รับความไว้วางใจจากองค์กรต่าง ๆ กว่า 15,000 แห่งในกว่า 100 ประเทศทั่วโลก ครอบคลุมทุกส่วนงานสำคัญ ๆ ในทุกกลุ่มอุตสาหกรรมและองค์กรทุกขนาด
ดูข้อมูลเพิ่มเติมเกี่ยวกับแนวทางของการ์ทเนอร์ในการช่วยให้ผู้บริหารตัดสินใจอย่างถูกต้องเพื่อขับเคลื่อนอนาคตของธุรกิจได้ที่ gartner.com